


Weekly Market Commentary October 26, 2026
LPL Research examines three keys to earnings season: broader profit growth, margin pressures, and high expectations amid continued AI investment.

Last Edited by: LPL Research
Last Updated: October 26, 2026
Big Numbers, Big Expectations: Three Keys to Earnings Season
Corporate America faces a higher bar this earnings season. Technology and artificial intelligence (AI) names remain in the spotlight amid ongoing spending, financing, and monetization scrutiny, while the macro backdrop remains clouded by rising energy prices and inflation pressures, higher borrowing costs, and heightened geopolitical risks. This begs several questions for markets. Is technology the only earnings driver? Are expectations too high? Can margins keep expanding? Here, we will discuss these three keys for the reporting cycle in our preview of third quarter earnings season.
Big Numbers but High Expectations
We are now over a week into third quarter earnings season, and so far, we would characterize the results as mixed against a high bar. With about one quarter of S&P 500 companies having reported, with the biggest segment being banks and capital markets, results have not been particularly impressive as a group. While a solid 83% of companies have exceeded earnings targets, the average upside earnings surprise has been meager at 2.5%.
Growth from the companies that have reported has been outstanding at 38%; and once all the numbers are in, our expectation is third quarter S&P 500 earnings per share (EPS) growth will be in that range despite the slow start (third quarter S&P 500 EPS growth is now tracking to 29%). That could change over the next couple of weeks as the big technology companies report results (Alphabet (GOOG/L) Amazon (AMZN), and Microsoft (MSFT) report this week). That's where growth and upside will likely come from.
Another Quarter of Over 30% Earnings Growth Expected
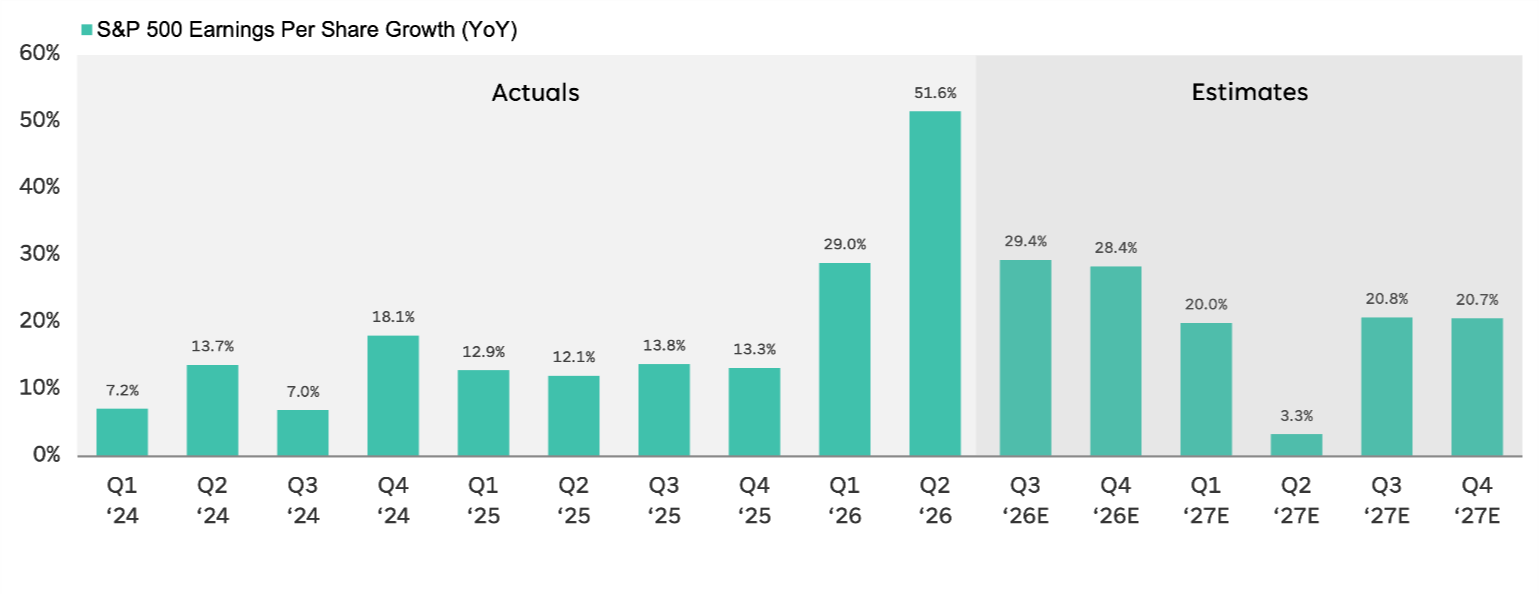
Source: LPL Research, FactSet 10/22/26
Disclosure: All indexes are unmanaged and cannot be invested in directly. Past performance is no guarantee of future results. Estimates may not materialize as predicted and are subject to change.
Key #1: Earnings Growth Outside of AI
One of the more encouraging developments this year about earnings has been the broadening beyond AI infrastructure and cloud computing. Technology clearly remains the dominant driver, but healthy economic growth is increasingly translating into very respectable earnings gains for the rest of corporate America.
Despite headwinds, consider real (inflation adjusted) gross domestic product (GDP) growth may exceed 3% for the third quarter, up from the consensus forecast of 1.8% three months ago. Add inflation to that to get nominal GDP, which has historically been well correlated to revenue, and you get more than 6%.
That supportive backdrop is consistent with the numbers. The segment of the S&P 500 that is not directly AI-related is expected to grow earnings at a 17% clip in the third quarter. With the upside that companies typically generate, earnings growth of over 20% from that segment seems very likely.
Slicing this another way, earnings excluding the technology sector are expected to grow 13% based on current consensus estimates. Add in the typical upside, and that pace should be in the high teens. Also consider that six of the 10 S&P sectors not named technology are expected to generate double-digit earnings gains.
Bottom line, we view AI as an earnings accelerator, but it is not the only game in town. A broader mix of industries contributing to profit growth can strengthen the earnings foundation underneath this market. When the AI-trade and semiconductors aren't working, it's nice for the broad market averages to have something else to fall back on.
AI is the Key Earnings Driver, but Earnings from the Rest of the Market are Solid
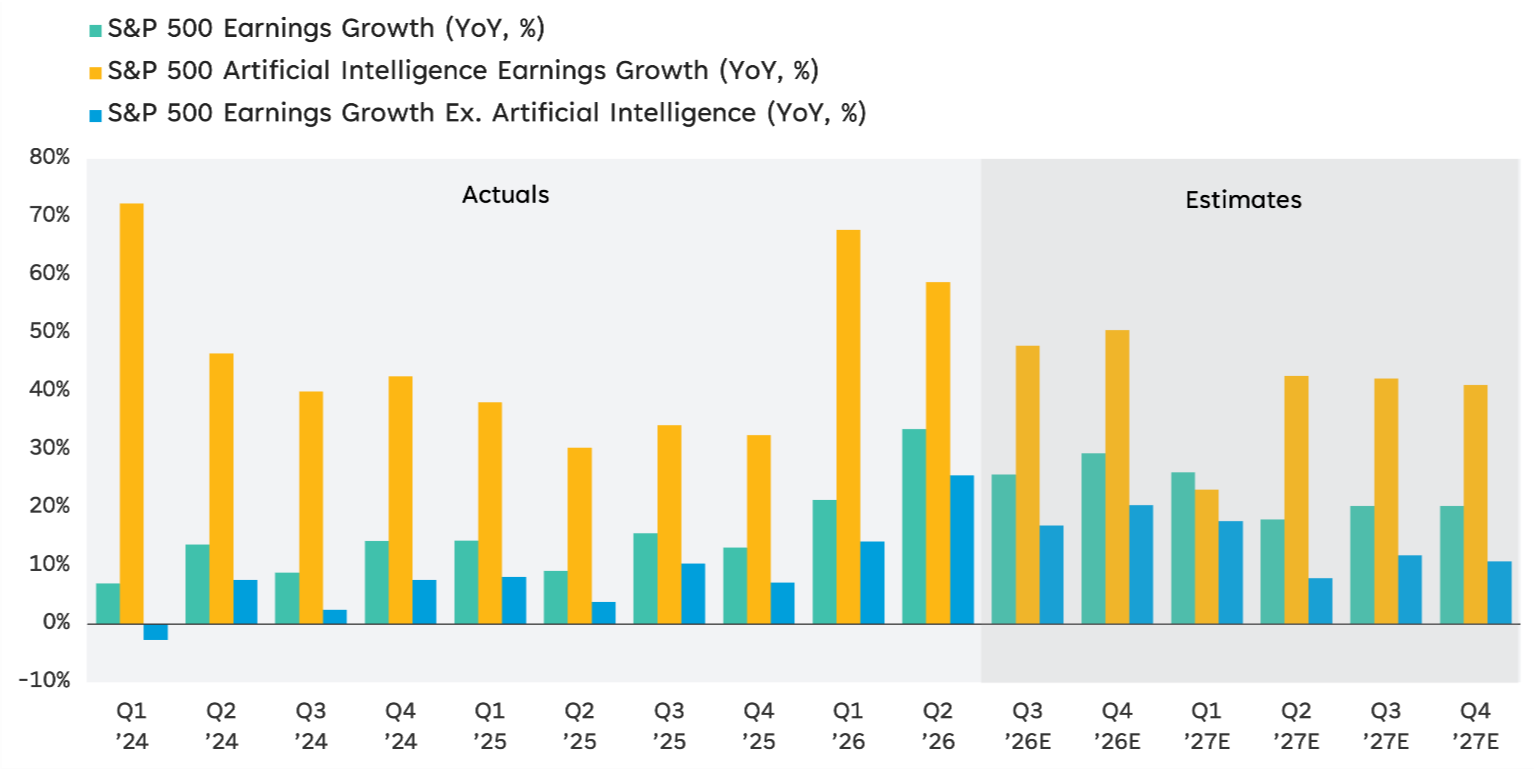
Source: LPL Research, Bloomberg 10/22/26
Disclosures: All indexes are unmanaged and cannot be invested in directly. Past performance is no guarantee of future results. Estimates may not materialize as predicted and are subject to change.
Key #2: Preserving the Margin Outlook
It's no secret that corporate America is enjoying a boom in profits. Part of that profit boom has been driven by expanding profit margins. Although expectations through 2027 may be too high based on historical “mean reversion” patterns, we expect AI adoption to drive higher productivity, and with that productivity should come higher margins. But realizing that productivity benefit will take time.
Inflation will remain a challenge in the near term, as higher commodity prices and transit disruptions will make margin expansion tougher. Meanwhile, higher costs of financing will likely weigh on net margins for the foreseeable future. Bottom line, achieving seemingly aggressive margin expansion expectations for the technology sector over the next six quarters is possible (consensus is now calling for +3 points), but it will be difficult for the rest of the sectors to help.
Keep in mind the broad market has become much more technology heavy in recent years, boosting baseline profit margins and increasing the likelihood that overall profit margins will expand, albeit gradually and modestly.
Key #3: High Expectations
Corporate earnings guidance entering the third-quarter reporting season was unusually positive. According to Bloomberg data, 41% of S&P 500 companies that provided third-quarter guidance raised estimates, the highest positive guidance ratio in over five years and well above the 10-year average of 23.9%. On average, the consensus S&P 500 EPS estimate drops about 2% during a quarter. For the third quarter, analysts raised estimates by about 2.5%.
That begs the question of whether strong guidance increases the chance that stocks fall on earnings disappointment. We analyzed quarterly guidance data back to 2012 and found the opposite has been true. The best three-month returns followed strong guidance (average +6.2%, median +7.1%), while the weakest returns (average +0.7%, median +1.0%) followed the more negative guidance ratios. In other words, stocks have handled high expectations well and clearing a low bar has not been rewarded.
Strong Guidance Has Historically Preceded Better Returns
Average S&P 500 price return during the next three months, by guidance-ratio quintile
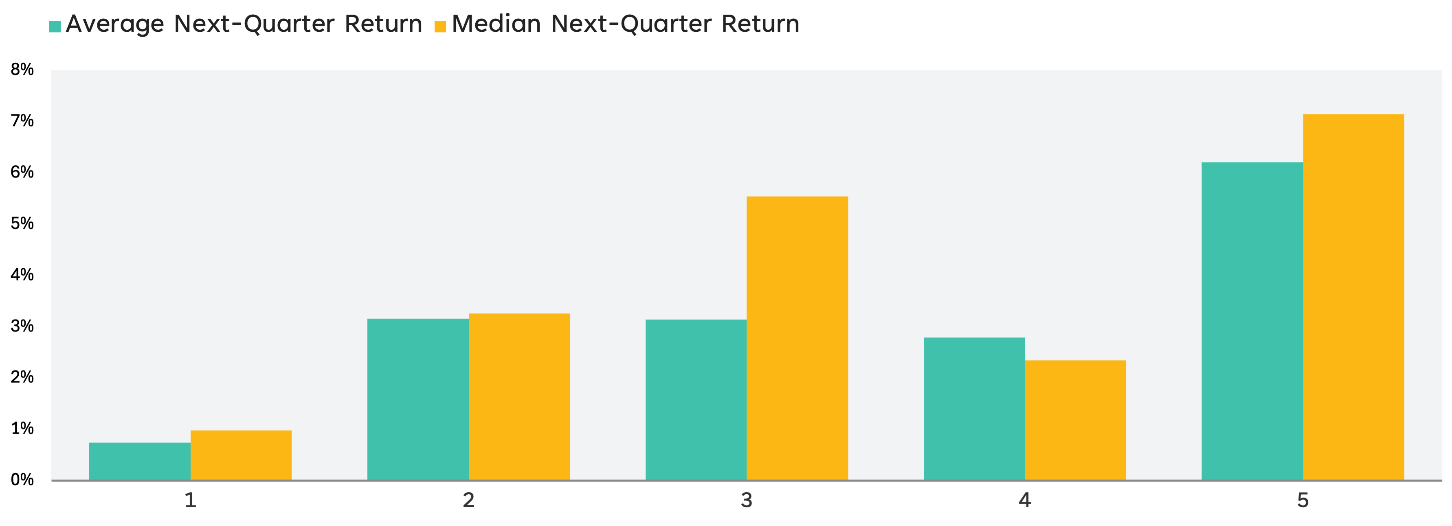
Source: LPL Research, Bloomberg, as of 10/22/26 (Quintile one is weakest guidance ratio, quintile five is strongest. Data 2012 through Q2 2026)
Disclosures: All indexes are unmanaged and cannot be invested in directly. Past performance is no guarantee of future results.
Unusual Ascent in Earnings Estimates
The massive upside to capital expenditures guidance this year, which caused strategists including LPL Research to dramatically underestimate earnings, is unlikely to be repeated in 2027. The “Jump in Earnings Estimates in 2026 is Rare” chart illustrates the unusually sharp rise in estimates this year. However, given the balance sheet strength of the companies doing the investing, pricing power, expected productivity gains from AI adoption, and the apparent nearly insatiable demand for computing power, we would not be surprised if our estimates ended up being a bit too low again.
The Jump in Earnings Estimates in 2026 is Rare
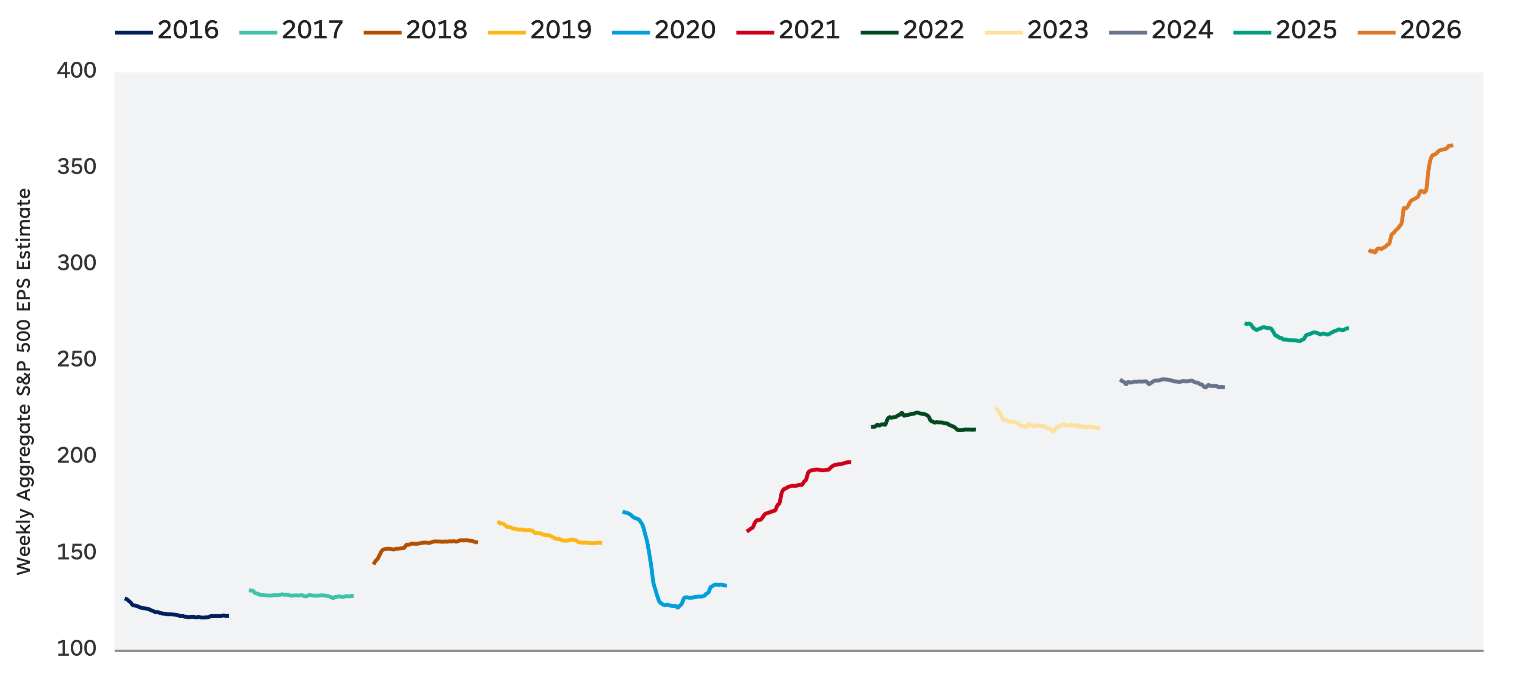
Source: LPL Research, FactSet, 10/22/26
Disclosures: All indexes are unmanaged and cannot be invested in directly. Past performance is no guarantee of future results. Estimates may not materialize as predicted and are subject to change.
We expect S&P 500 companies in aggregate to generate double-digit earnings growth in 2027, supported by continued AI investment, a broadening of earnings gains, and a resilient economy. Whether corporate America can exceed our latest 2027 S&P 500 EPS estimate for next year of $390, an 11% increase from our $350 estimate for 2026, will largely be a function of AI investment, which we believe will exceed $1 trillion next year despite increasing financing costs.
In terms of risks, financing the AI buildout is a big one given higher interest rates, uncertain payoffs, and dwindling free cash flow. The macroeconomic and policy environment also remains a wildcard, including potential margin pressures from commodity inflation in the event of continued shipping disruptions in the Persian Gulf as well as regulatory headwinds for data center construction.
Conclusion
Corporate America faces a high bar this earnings season, but the underlying profit picture remains encouraging. AI investment continues to power exceptional growth, while improving contributions from other sectors suggest the earnings foundation is becoming broader and more durable.
High expectations alone probably won't derail this market. Our historical analysis suggests stronger guidance has generally preceded better subsequent quarterly returns, though past performance does not guarantee future results.
Still, sustaining profit growth will require companies to navigate commodity inflation, ongoing shipping disruptions, rising financing costs, and constrained cash flows. AI productivity gains offer support, but margin expansion will likely be slow and not follow a straight line. Overall, broadening earnings strength helps support our constructive stock market outlook, balanced against macroeconomic uncertainty and execution risk surrounding the AI buildout.
Asset Allocation Insights
LPL's Strategic and Tactical Asset Allocation Committee (STAAC) maintains its recommendation for a tactical equity overweight and fixed income underweight. We believe the AI-driven earnings boom and potential for improvement in the macro backdrop will support the broad equity market through 2026. The Committee favors the quality factor domestically to express the tactical equity overweight, backed by resilient U.S. economic growth, relative insulation from possible additional energy shocks, and AI innovation.
The Committee holds a slight preference for the value style over its growth counterpart given cyclical tailwinds, relatively more attractive valuations, and our positive view of the energy sector. The Committee recently upgraded the technology sector to overweight given significant technical momentum, the reset of extreme positioning, and strong earnings growth, and maintains an underweight stance toward the consumer discretionary and real estate sectors due to weak technical analysis conditions, sticky inflation, and elevated interest rates.
Jeffrey Buchbinder, CFA, Chief Equity Strategist, LPL Financial
Important Disclosures
This material is for general information only and is not intended to provide specific advice or recommendations for any individual. There is no assurance that the views or strategies discussed are suitable for all investors or will yield positive outcomes. Investing involves risks including possible loss of principal. Any economic forecasts set forth may not develop as predicted and are subject to change.
References to markets, asset classes, and sectors are generally regarding the corresponding market index. Indexes are unmanaged statistical composites and cannot be invested into directly. Index performance is not indicative of the performance of any investment and do not reflect fees, expenses, or sales charges. All performance referenced is historical and is no guarantee of future results.
Any company names noted herein are for educational purposes only and not an indication of trading intent or a solicitation of their products or services. LPL Financial doesn't provide research on individual equities.
All information is believed to be from reliable sources; however, LPL Financial makes no representation as to its completeness or accuracy.
All investing involves risk, including possible loss of principal.
US Treasuries may be considered “safe haven” investments but do carry some degree of risk including interest rate, credit, and market risk.
Bonds are subject to market and interest rate risk if sold prior to maturity. Bond values will decline as interest rates rise and bonds are subject to availability and change in price.
The Standard & Poor's 500 Index (S&P500) is a capitalization-weighted index of 500 stocks designed to measure performance of the broad domestic economy through changes in the aggregate market value of 500 stocks representing all major industries.
The PE ratio (price-to-earnings ratio) is a measure of the price paid for a share relative to the annual net income or profit earned by the firm per share. It is a financial ratio used for valuation: a higher PE ratio means that investors are paying more for each unit of net income, so the stock is more expensive compared to one with lower PE ratio.
Earnings per share (EPS) is the portion of a company's profit allocated to each outstanding share of common stock. EPS serves as an indicator of a company's profitability. Earnings per share is generally considered to be the single most important variable in determining a share's price. It is also a major component used to calculate the price-to-earnings valuation ratio.
All index data from FactSet or Bloomberg.
This research material has been prepared by LPL Financial LLC.
Not Insured by FDIC/NCUA or Any Other Government Agency | Not Bank/Credit Union Guaranteed | Not Bank/Credit Union Deposits or Obligations | May Lose Value
RES-0007122-0526 Tracking #1195838 | #1195840 (Exp. 10/27)